1. Introduction
Spot finding is a crucial step in microarray image analysis. The goal is to identify the spot signal, i.e., the pixels that truly represent the signal intensity of the gene, peptide, antibody, or protein printed at a spot. This process determines the quality of the analysis. However, it is challenging when the spot signal’s shape and intensity profile are diverse or the spot signal is shifted away from the originally printed position.
2. Spot Finding Technique
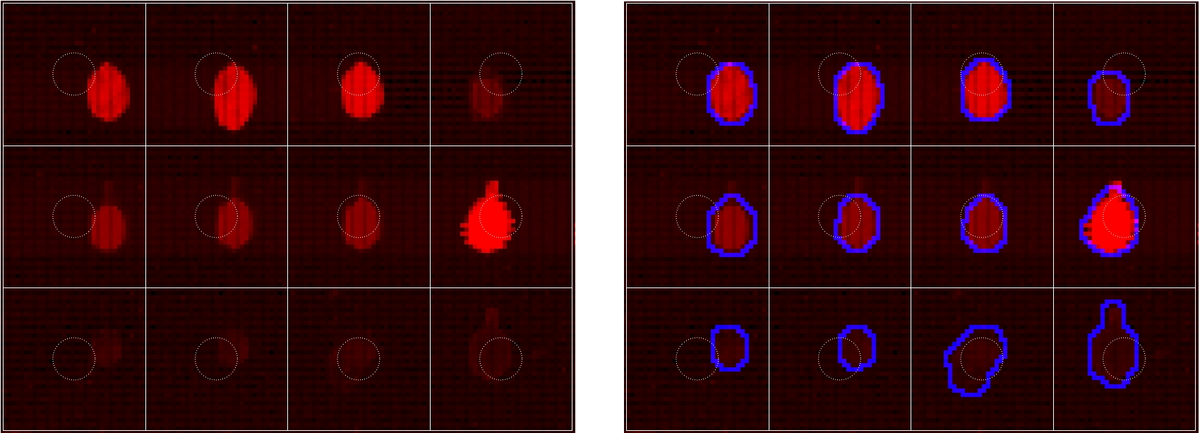
In this article, we present a powerful spot finding method based on boundary evolution and spot morphology. This technique is illustrated with an image (Figure 1, left) that has a diversity of spot shapes and intensity profiles. Additionally, the spot signal is shifted from the originally printed position (Figure 1, dashed circles) in different directions. Our objective is to identify the spot signal and highlight its boundary in blue (Figure 1, right).
3. Detailed Explanation
Problem Formulation
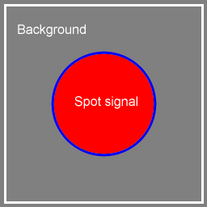
Consider the array image (Figure 1, left) consisting of 12 spots arranged in 3 rows and 4 columns. Each spot image is bounded by a white square whose size is the vertical and horizontal spot spacing. We need to divide each spot image into two regions: spot signal and background. A simple spot image is illustrated in Figure 2; it is made of only two colors: gray background and the spot signal being a red disc.
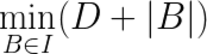
We need a method that supports: (1) grouping pixels with similar intensity values into two regions separated by a boundary, and (2) the boundary being as close to the spot signal as possible. This can be formulated as an optimization problem:
where I is the spot image, D is the measure of dissimilarity of pixels’ intensity values in the same region, and |B| is the length of the boundary B.
Solution
To solve the optimization problem, the spot finding method works as follows:
- Start with an initial boundary located at the border of the spot image.
- Evolve the boundary to minimize (D + |B|).
- Return the optimal boundary.
Reducing D ensures that the pixels in the spot signal region are more similar in terms of intensity value, and so are the pixels in the background region. Meanwhile, decreasing |B| makes the boundary smoother. Both result in a boundary closer to the spot signal region. For example, in Figure 2, the boundary initialized at the spot image border (i.e., the white square) will converge to the blue circle enclosing the disc, even if the disc’s size and position change.
4. Step-by-Step Process
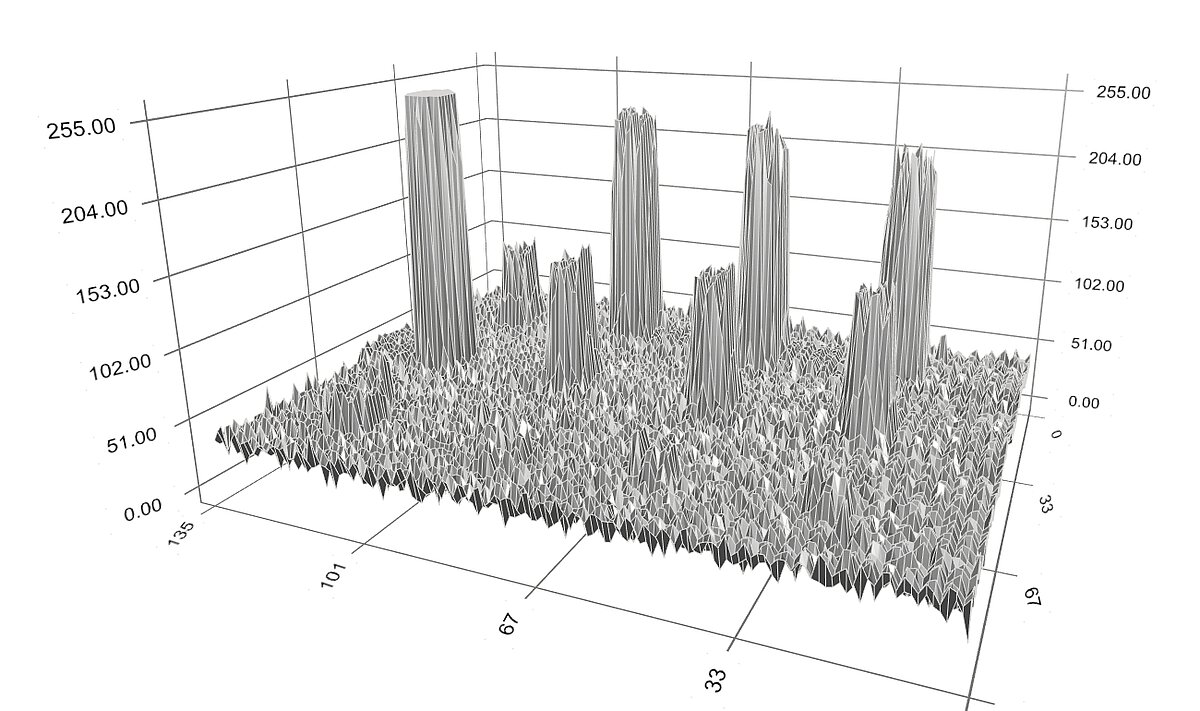
Consider again our example with the array image in Figure 1 (left). The spots’ intensity profile is depicted in Figure 3.
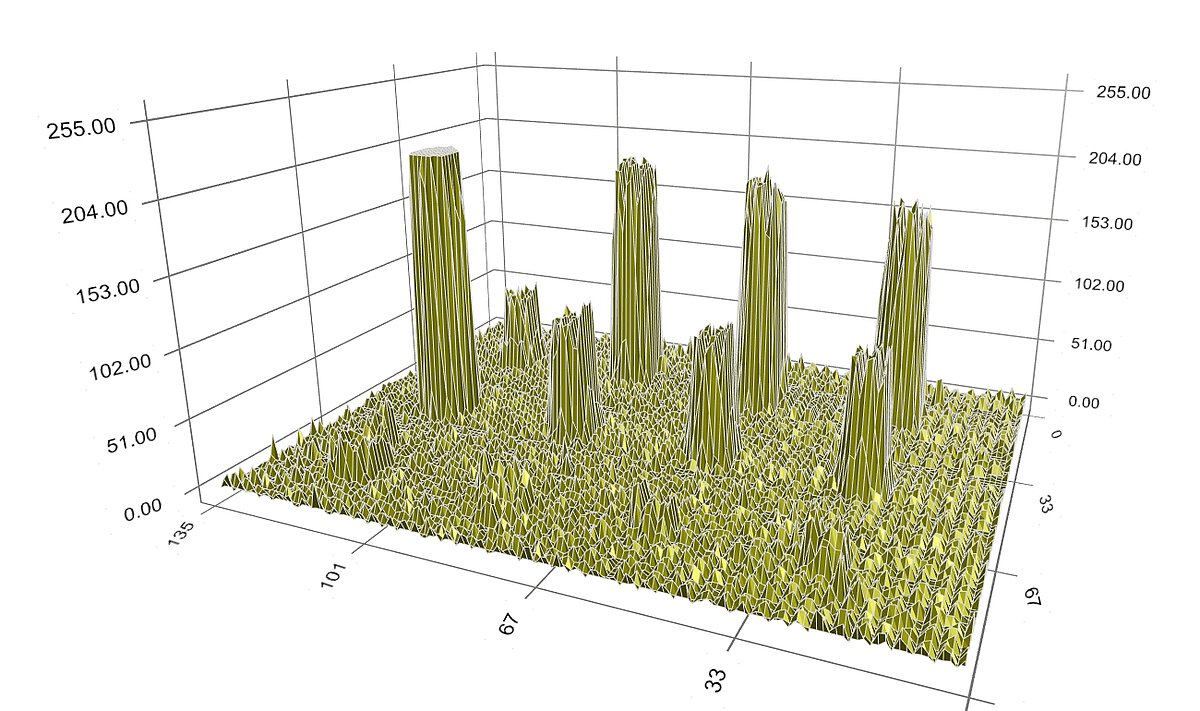
We first apply the background noise processing technique that is based on spot morphology. The background-corrected intensity profiles are shown in dark-yellow in Figure 4. Note that there still remains noise of small size.
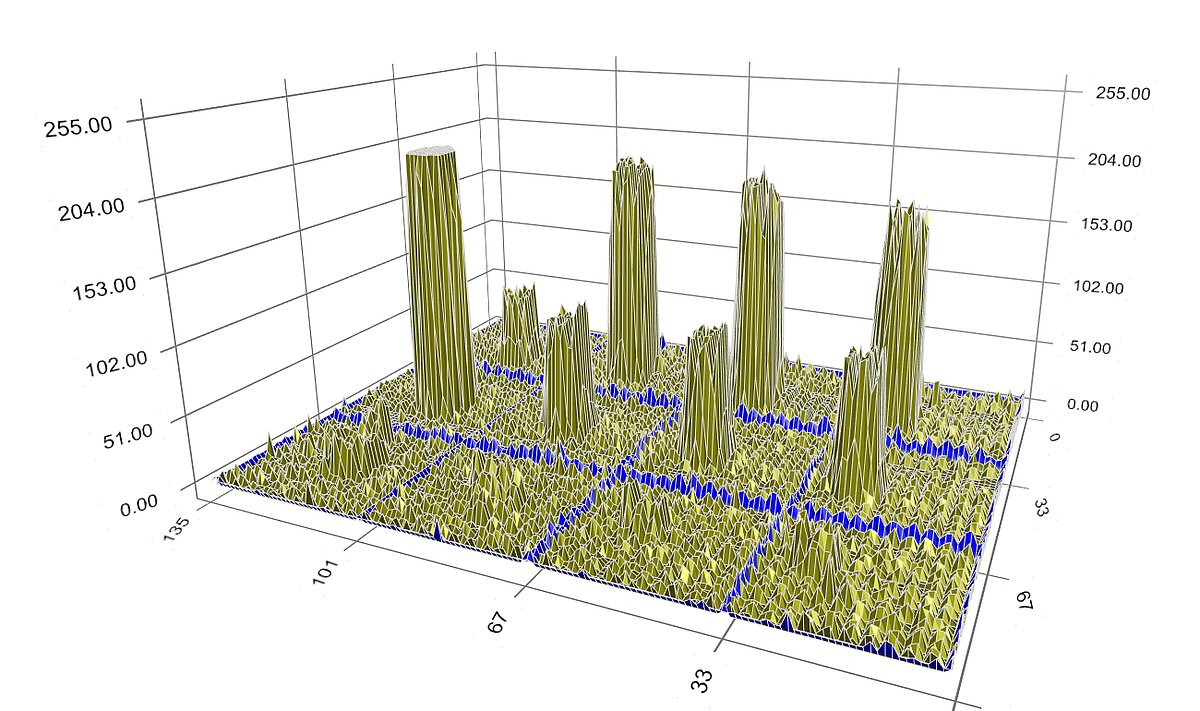
Initial Boundary
At the beginning of the search, the boundary (shown in blue) is located at the border of each spot image (Figure 5).

Boundary Evolution
During evolution, the boundary moves closer to the spot signal (Figure 6) to reduce the dissimilarity of pixels within the blue boundary (i.e., the spot signal) and outside it (i.e., the background), as well as to shorten the boundary’s perimeter.
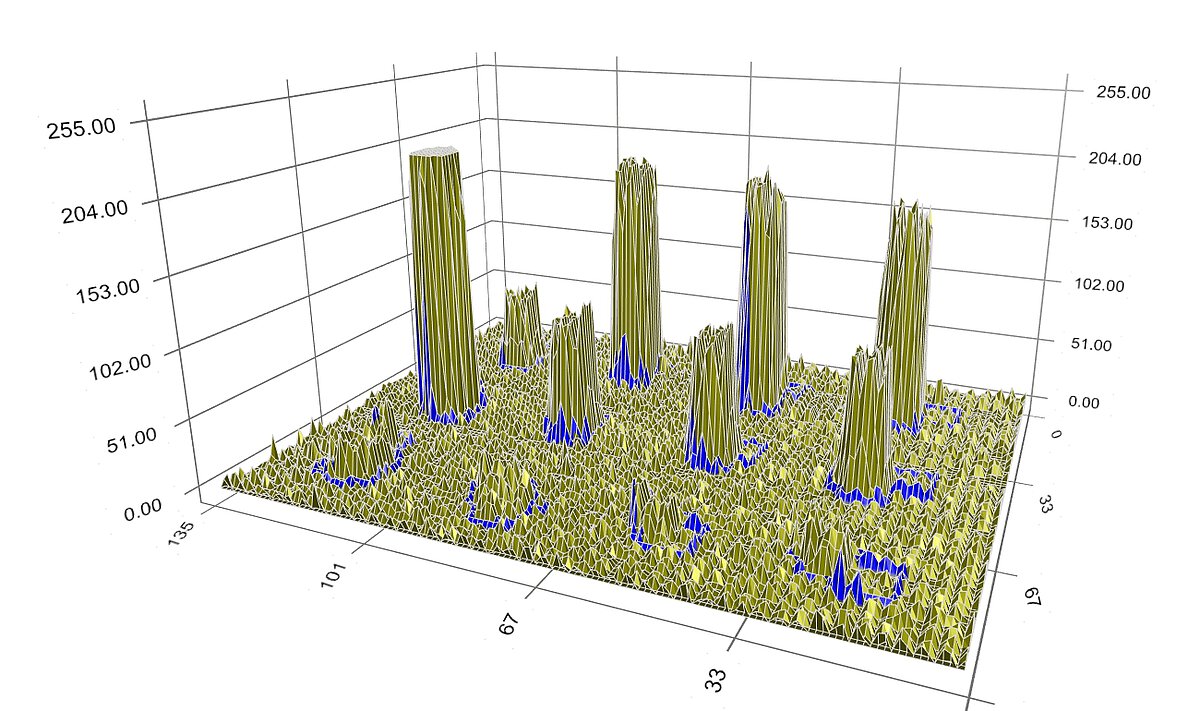
The boundary keeps moving closer to the spot signal (Figure 7). However, some boundary still encloses noise away from the spot signal.
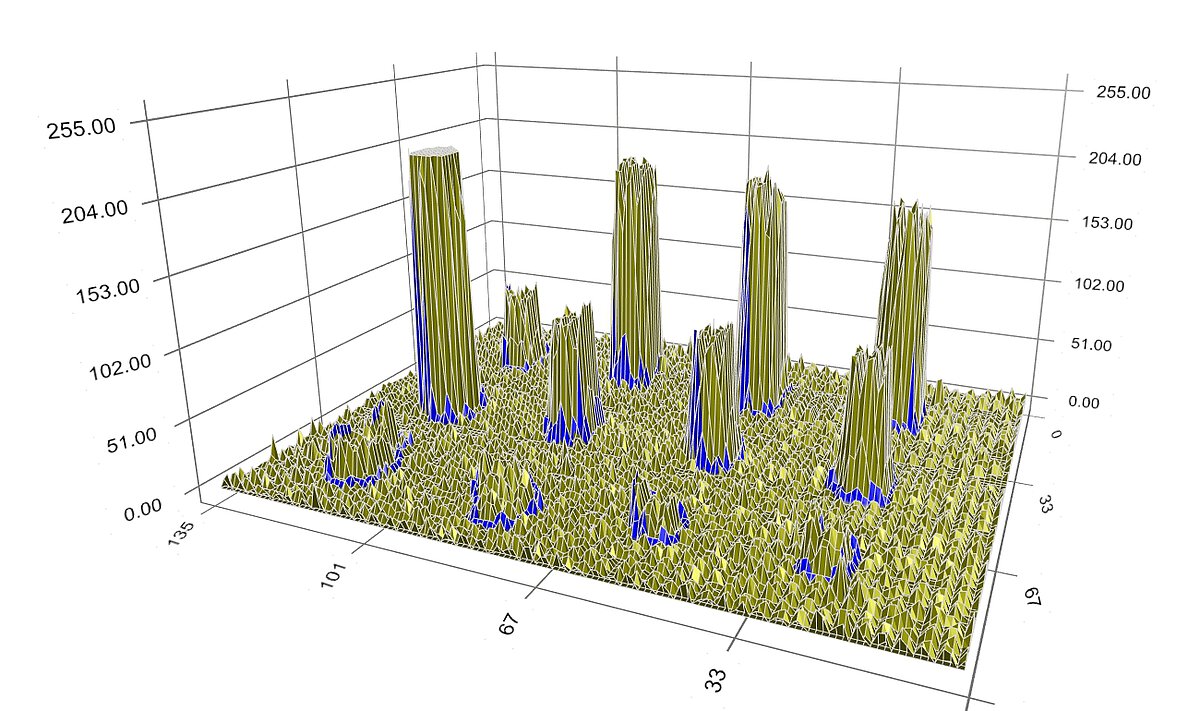
Final Boundary
Finally, when optimality is reached, the boundary converges at the border of the spot signal (Figure 8).
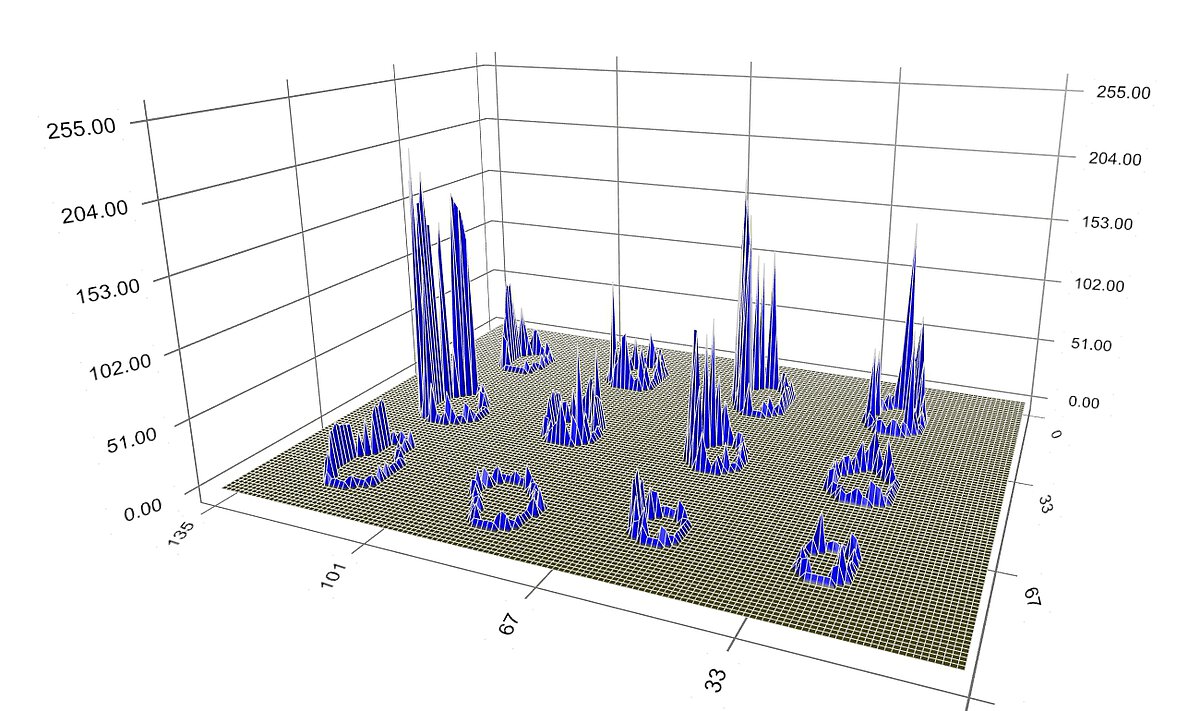
Figure 9 depicts the final spots’ boundary alone, representing the spot signal border.
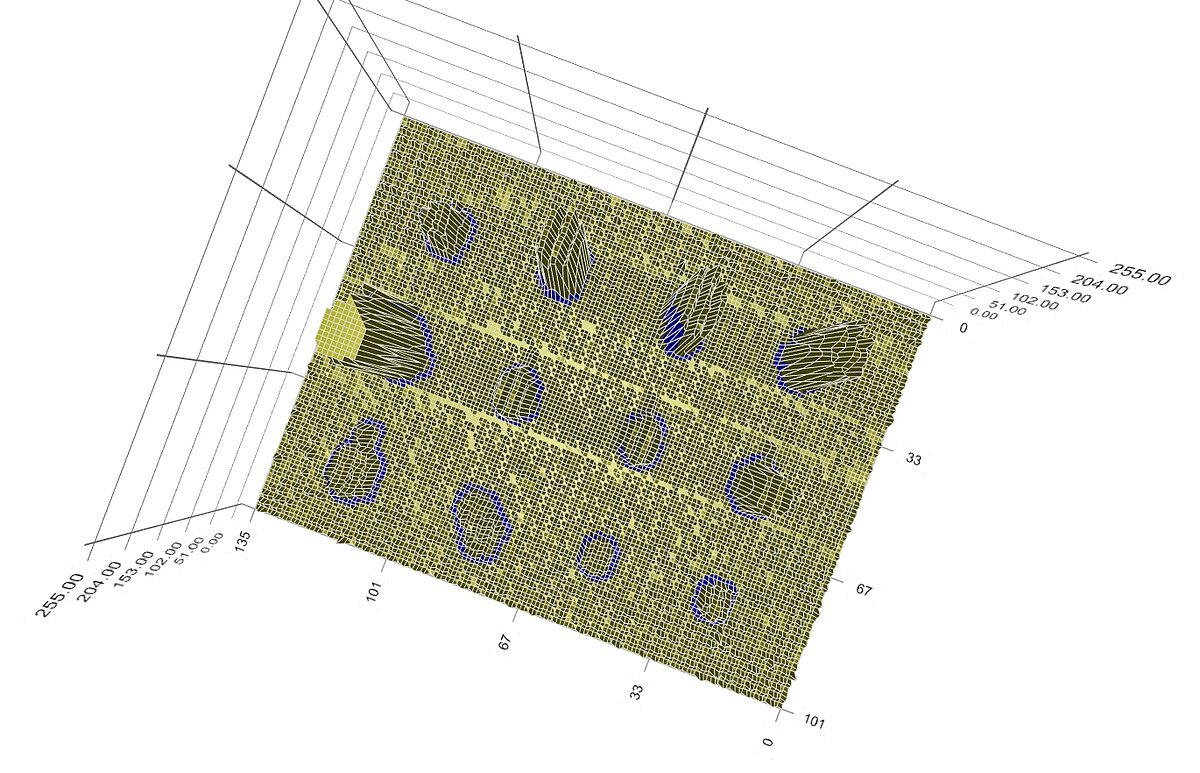
A top-view of the spots’ intensity profile and boundary is shown in Figure 10. Despite the diversity of intensity value, shape, and position of the spot signal, the method works as expected; the (blue) boundary clearly identifies the spot signal and separates it from the background.
5. Conclusion
We have presented a powerful spot finding method based on boundary evolution. In fact, it is used as an object detection technique in many computer vision applications. Our spot finding also employs a background noise processing procedure based on spot morphology.
For microarray image analysis, these spot finding and background noise processing methods are integrated into the Flex-Spot method of the Spotxel® Microarray software. To learn more about our technologies and methods, please visit our Technologies & Method page. You can also watch the video describing the technique below.